发现 
该作品还没有经过官方审核。访问演示、下载或复制命令前,请自行确认来源可信。
详细介绍
项目简介
plow 是一个用 Golang 编写的 HTTP(S) 基准测试(压测)工具。它使用高性能的 fasthttp 代替 Go 默认的 net/http。
plow 会以指定的并发连接数(-c)运行,并实时记录汇总统计、执行时间直方图、计算分位数,同时显示在 Web UI 和终端上。它可以运行指定时长(-d)、固定请求数(-n),或直到按下 Ctrl-C 中断。
实时计算直方图和分位数采用受 prometheus 启发的流式算法,内存与 CPU 占用低,对压测本身的性能开销几乎可以忽略。
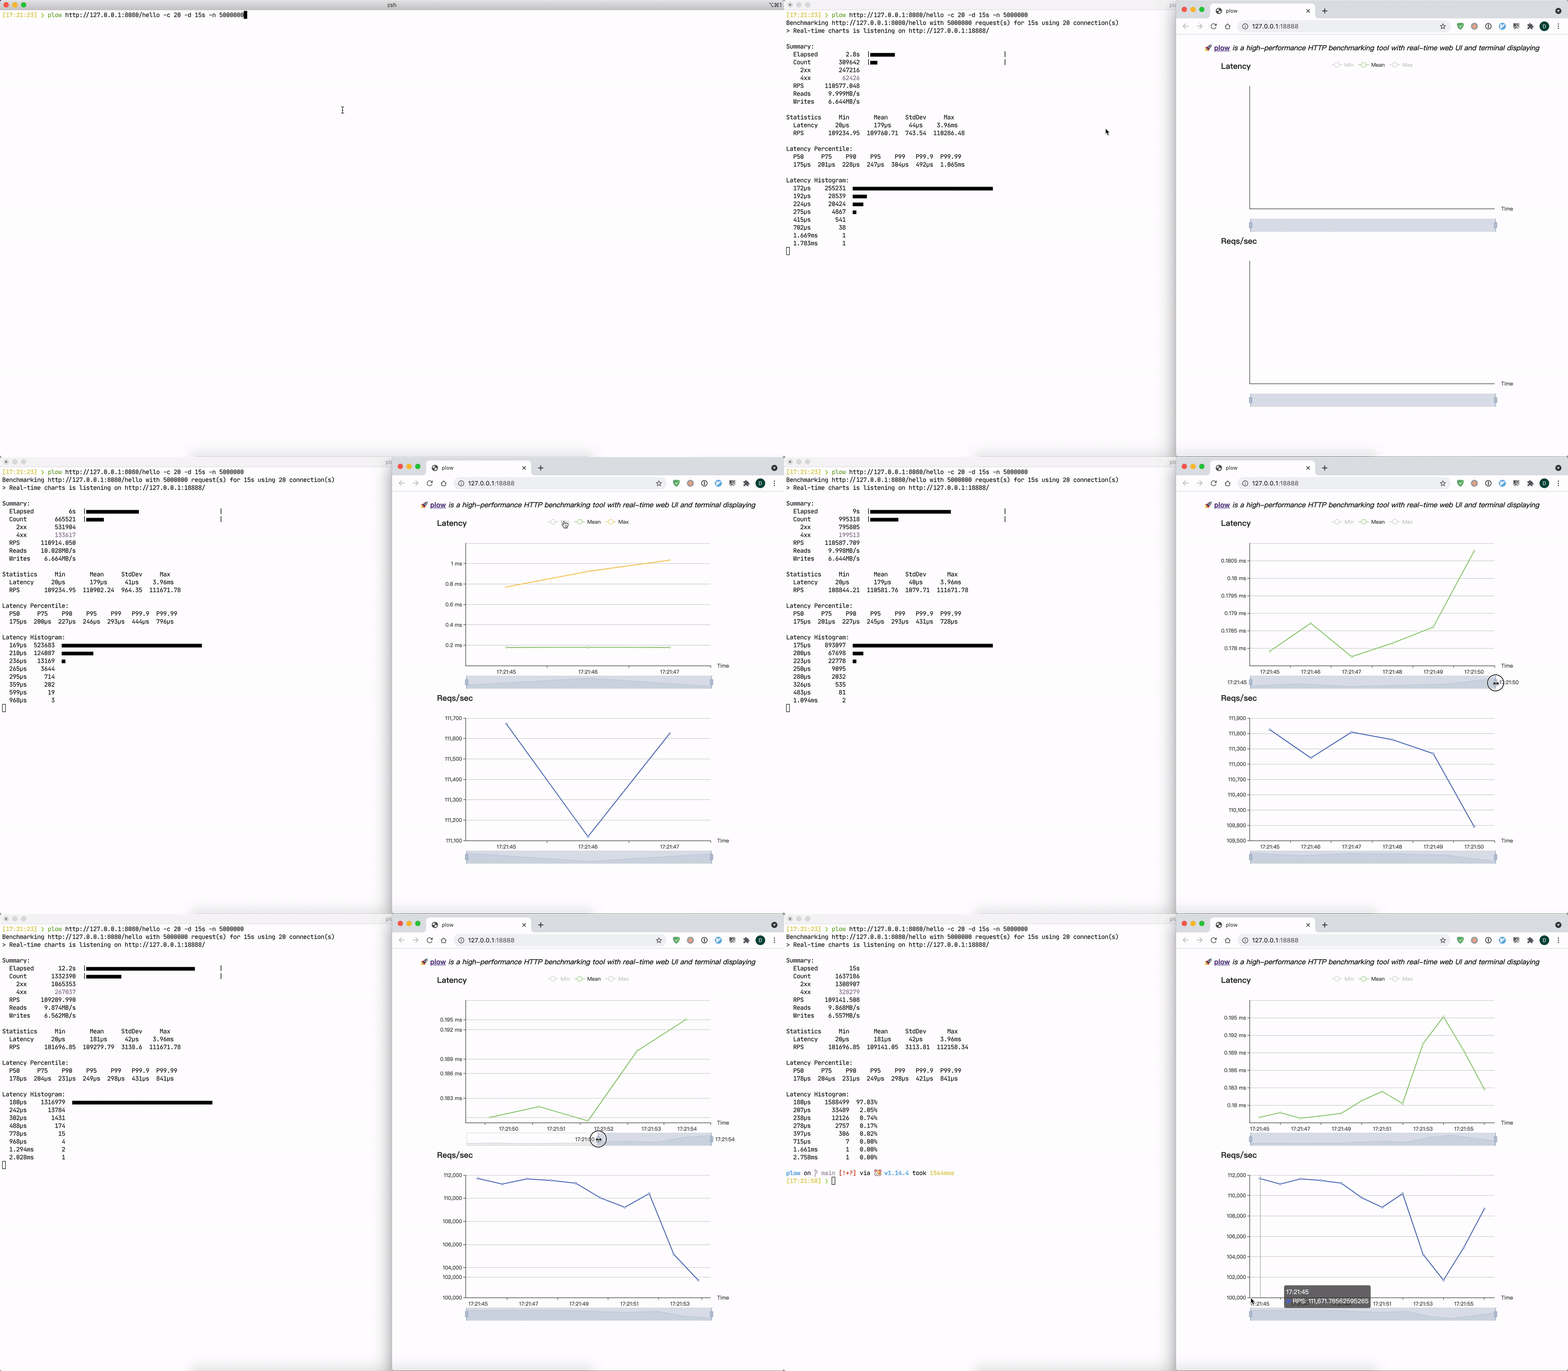
终端输出示例:
❯ ./plow http://127.0.0.1:8080/hello -c 20
Benchmarking http://127.0.0.1:8080/hello using 20 connection(s).
@ Real-time charts is listening on http://[::]:18888

Summary:
  Elapsed        8.6s
  Count        969657
    2xx        776392
    4xx        193265
  RPS      112741.713
  Reads    10.192MB/s
  Writes    6.774MB/s

Statistics    Min       Mean     StdDev      Max
  Latency     32µs      176µs     37µs     1.839ms
  RPS       108558.4  112818.12  2456.63  115949.98

Latency Percentile:
  P50     P75    P90    P95    P99   P99.9  P99.99
  173µs  198µs  222µs  238µs  274µs  352µs  498µs
主要功能
- 实时 Web 图表与终端快照双展示,默认监听
:18888 - 并发连接数(
-c)、每秒请求速率(--rate)、并发爬坡(--ramp-up)控制 - 按请求数(
-n)或时长(-d)运行,也可 Ctrl-C 中止 - 延迟分位数(P50 ~ P99.99)与延迟直方图
--trace分阶段追踪请求延迟:DNS、Connect、TLS、Write、Wait(TTFB)、Read- 支持请求体文件、自定义 Header、Content-Type、TLS 客户端证书
- 支持 Socks5 代理、HTTP 代理与 Unix domain socket 请求
- 结果可输出为 JSON,错误可写入文件,支持 Bash/ZSH 命令补全
安装与使用
二进制与镜像发布在 releases 页面。
通过 Go 安装:
go install github.com/six-ddc/plow@latest
通过 Homebrew 安装:
# brew update
brew install plow
通过 Docker 运行:
docker run --rm --net=host ghcr.io/six-ddc/plow
# docker run --rm -p 18888:18888 ghcr.io/six-ddc/plow
基本用法:
plow http://127.0.0.1:8080/ -c 20 -n 10000 -d 10s
发送 JSON 文件:
plow https://httpbin.org/post -c 20 --body @file.json -T 'application/json' -m POST
追踪各请求阶段延迟:
plow http://localhost:8080/ -c 20 -d 4s --trace
Latency Phases  Count    Min     Mean      P50      P90      P99      Max
  DNS              20  2.963ms  4.073ms  3.785ms  5.381ms  5.565ms  5.565ms
  Connect          20   226µs   1.025ms  1.014ms   1.8ms   2.475ms  2.475ms
  TLS               0     -        -        -        -        -        -
  Write         12894    3µs      9µs      6µs     11µs     112µs    783µs
  Wait          12894  4.869ms  5.758ms  5.585ms  6.332ms  8.845ms  25.494ms
  Read          12894   70µs     253µs    178µs    426µs   1.231ms  17.633ms
常用参数(完整列表见 plow --help):
  -c, --concurrency=1            Number of connections to run concurrently
      --rate=infinity            Number of requests per time unit, examples: --rate 50 --rate 10/ms
      --ramp-up=-1               Concurrently will increase pre seconds
  -n, --requests=-1              Number of requests to run
  -d, --duration=DURATION        Duration of test, examples: -d 10s -d 3m
  -i, --interval=200ms           Print snapshot result every interval, use 0 to print once at the end
      --json                     Print snapshot result as JSON
      --trace                    Trace latency of request phases: DNS, Connect, TLS, Write, Wait(TTFB), Read
  -b, --body=BODY                HTTP request body, if body starts with '@' the rest will be considered a file's path
  -m, --method="GET"             HTTP method
  -H, --header=K:V ...           Custom HTTP headers
      --listen=":18888"          Listen addr to serve Web UI
      --socks5=ip:port           Socks5 proxy
      --http-proxy=username:password@ip:port
      --auto-open-browser        Specify whether auto open browser to show web charts
      --unix-socket=UNIX-SOCKET  Unix domain socket path to use for connection
Bash/ZSH 补全:
eval "$(plow --completion-script-bash)"
eval "$(plow --completion-script-zsh)"
注意事项
--trace中DNS、Connect、TLS仅在新连接建立时计量,因此其计数为连接数;Write为写请求耗时,Wait为请求写出到收到首个响应字节(TTFB)的时间,Read为读取剩余响应的时间。- 使用代理(
--socks5或HTTP(S)_PROXY环境变量)时,整个代理拨号过程计入Connect。 --body的值以@开头时,其余部分会被当作文件路径读取请求体;配合--stream可用 chunked 编码流式发送文件。- 各 flag 的默认值也可从环境变量读取,例如
PLOW_TIMEOUT=5s等价于--timeout=5s。 - Web UI 默认监听
:18888,可通过--listen修改,--auto-open-browser可自动打开浏览器。
本作品整理自 GitHub 开源项目 six-ddc/plow,原作者 @six-ddc,许可证 Apache-2.0。中文介绍由 AI 根据项目 README 整理,以原仓库为准。
更新记录
- v1.4.0当前版本
新增并发视图与 ramp-up 选项、Unix domain socket 请求支持和 HTTP 代理配置;修复 Go race detector 发现的并发问题及图表、报告、打印和请求处理中的多处问题,修复 IPv6 localhost 连接。
评论